
September 2nd, 2026
Over the 12 months ending June 2026, commercial facility base rates and conversion factors rose about 5%. Professional conversion factors rose 2.3%.
It's no surpise to anyone negotiating these contracts that facility tends to out-trend professional. What has never existed is a current measurement of how much key reimbursement terms are moving over time by methodology, measured on a monthly basis straight from the rates payers publish.
That measurement is the primary subject of our first Price Transparency Trend Report.
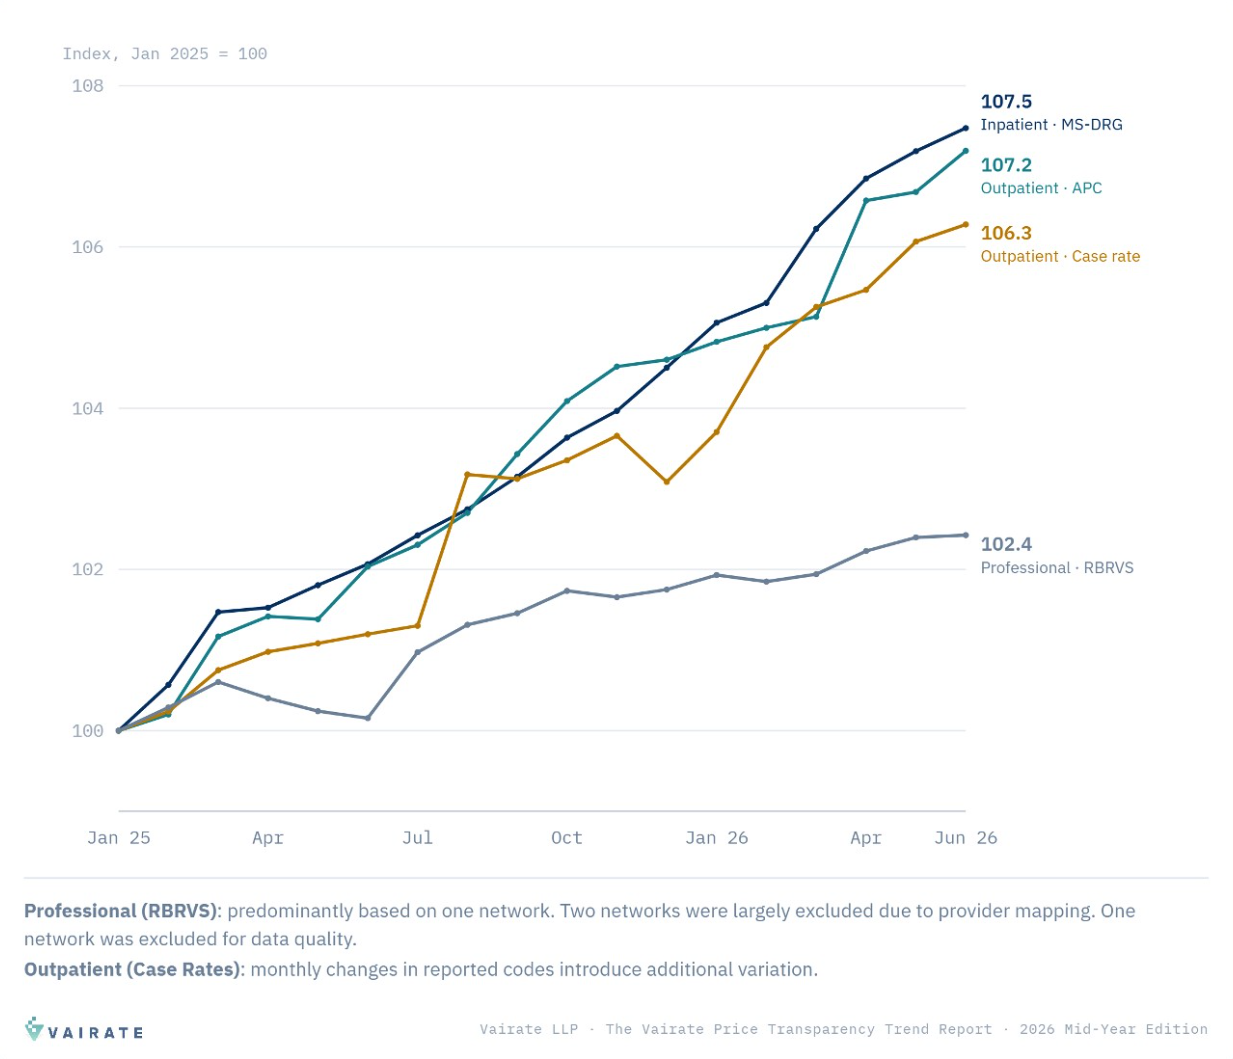
The steady increase over time is the key finding. Facility unit costs have continued to rise over the past 18 months, with no major acceleration or deceleration. The changes accumulate consistently, month over month, in a way that can only be seen from price transparency data.
We started from roughly 4,000 general acute care hospitals and 30,000 medical groups across four national PPO networks, and decoded more than 20,000 headline reimbursement terms out of their published machine-readable files.
Each contract reduces to a single headline number: an inpatient MS-DRG base rate, an APC or RBRVS conversion factor, or a weighted-average case rate. A contract enters the study only if the provider reports it in every full quarter of the window, so the cohort is fixed and a change in the average can't be an artifact of which contracts happened to show up that month. It is movement in the negotiated term itself.
One point of language, because it changes how you read the result. A conversion factor, or a base rate, is the multiplier that scales an entire fee schedule. It is not the total unit cost or the final allowed amount. What a provider is actually paid also depends on case mix, coding, payment policy, and carve-outs, none of which this study measures. When we say a base rate rose 5%, we are not saying reimbursement rose exactly 5%.
Existing trend studies rely on annual surveys and don't typically report unit cost. Claims studies run two to three years behind and, being built on deidentified data, can't resolve down to a specific network, provider, or reimbursement methodology.
Meanwhile every payer now publishes its negotiated rates. That is the raw material for exactly this measurement, and it makes the result both more current and more granular, because the same data that produces a national trend line resolves to an individual provider, methodology, and code.
The trend is the headline. The rest of the report provides key detail around:
It's available now, and it's 27 pages. Download it below.
Mottet, G. (2026). The Vairate Price Transparency Trend Report — 2026 Mid-Year Edition. Vairate. https://www.vairate.com/post/price-transparency-trend-report-2026-mid-year
Journalists, researchers, and analysts are welcome to cite and reproduce any figure in this post or the report with attribution and a link. If you need a specific cut, a higher-resolution exhibit, or a comment for a story, email greg@vairate.com.
Four national PPO networks. Data window January 2025 through June 2026, from files published through June 2026. Trend is measured on a quarter-consistent cohort and weighted by a non-dollar volume proxy. Professional (RBRVS) coverage this edition is concentrated in a single national network, so the professional figure is directional — one reason the report publishes professional trend but withholds a professional benchmark. No comparisons among individual networks are presented; all results pool across the four.
This is general market commentary and is not prepared for use in any specific negotiation, transaction, or rate filing. Prepared by Greg Mottet, FSA, Founder of Vairate, in accordance with applicable Actuarial Standards of Practice. Vairate has a direct commercial interest in this report: it is produced from the same decoded price transparency data offered commercially through DecipherPro, and it is distributed as marketing.
Vairate builds DecipherPro — negotiation intelligence for payer-provider contracting. DecipherPro decodes price transparency MRF data into underlying reimbursement terms and competitive benchmarks.

Enter your information below for immediate access to the complete report.


